CASE STUDY 3 OF 5
SHIPPED · JANUARY 2024
One view of who was being missed
Store leaders could record coaching, but could not see who was being missed. I designed a store-level view of employee coverage and coach activity, with follow-up paths that kept conversation notes private.
Status
Shipped January 2024.
Context
Best Buy Connect · internal employee platform
My role
Senior UX Designer · information hierarchy, drill-downs, interaction, privacy rules, and implementation documentation
Before: check employee profiles one at a time. After: one coverage view.
Before · profile by profile
One by one
employee profiles, coverage unknown

Continue profile by profile
Leaders checked individual profiles or rebuilt the numbers in a spreadsheet to understand store coverage.
After · illustrative store view
32 of 58
employees reached in this interface example
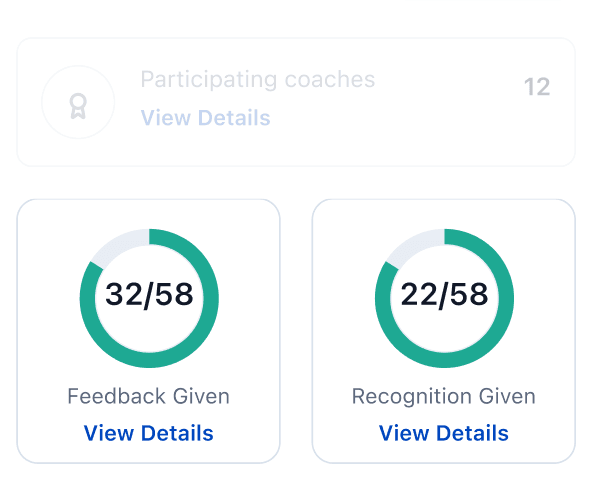
The coverage count opens the employees behind it, giving the summary a direct path to follow-up.
Visibility and privacy
Visibility could not become surveillance.
- Store leaders needed
- Who was being missed and where to follow up.
- Employees needed
- Private coaching conversations to remain private.
- Retail operations needed
- Consistent store-level reporting.
- Engineering needed
- Clear rules for which coaching information the view could show.
My decision
Show who was reached and who was coaching. Keep conversation notes out of the leadership view.
Project thesis
Coverage came before volume.
A high conversation count could still leave employees uncoached. I put employee coverage on the overview and coaching frequency in the detail view.
Coverage first, activity one level down
ANNOTATED · COACHING DASHBOARD
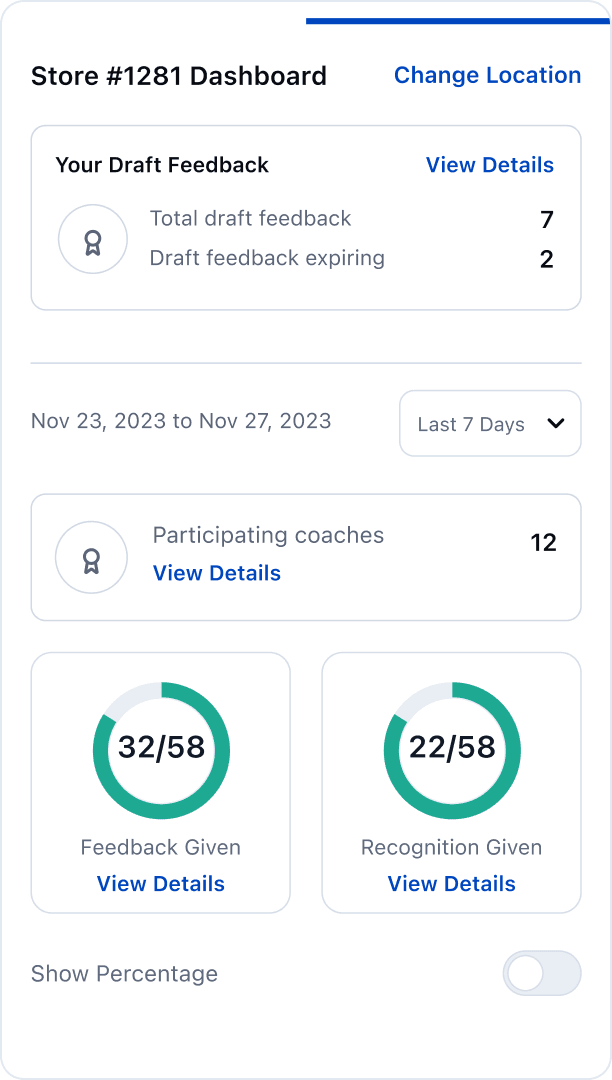
Unfinished work outranks the summary
Expiring drafts sit above the metrics so leaders see unfinished work first.
Coaches are people, not a count
Twelve opens the list of participating coaches.
Reach is the headline metric
The ring counts employees reached (32 of 58). Conversation volume sits in the detail view.
Counts by default, percentages on request
Show employee counts first, with a toggle for percentages.
Rules behind the view
Three rules behind responsible visibility
- 01
HIERARCHY
Lead with employee coverage
Put employees reached on the overview. Keep conversation counts in the detail view.
- 02
ROUTING
Separate employee and coach routes
Coverage opens the employees reached. Participation opens the coaches and their activity.
- 03
PRIVACY
Exclude private note content
Show activity records without the content of the coaching conversation.
Two signals, two distinct routes
Employee route
Coverage stays about employees
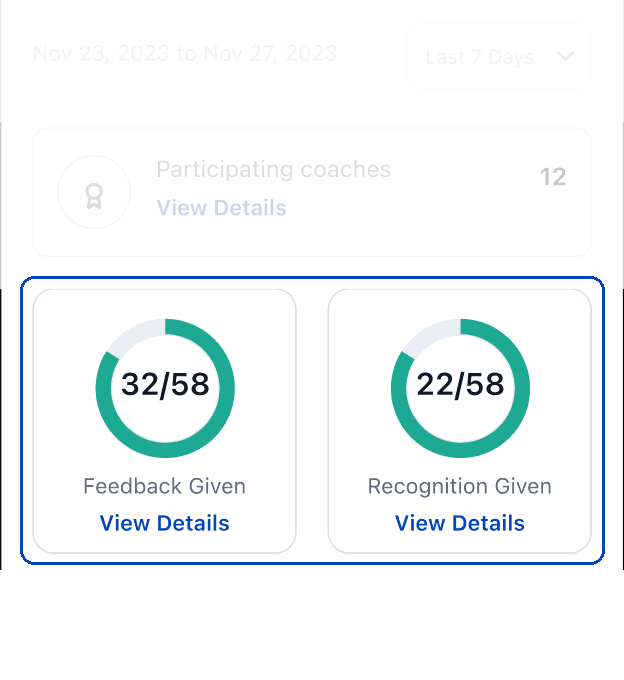
Open a coverage ring to see the employees reached with feedback or recognition.
Coach route
Participation leads to individual activity
Coach list
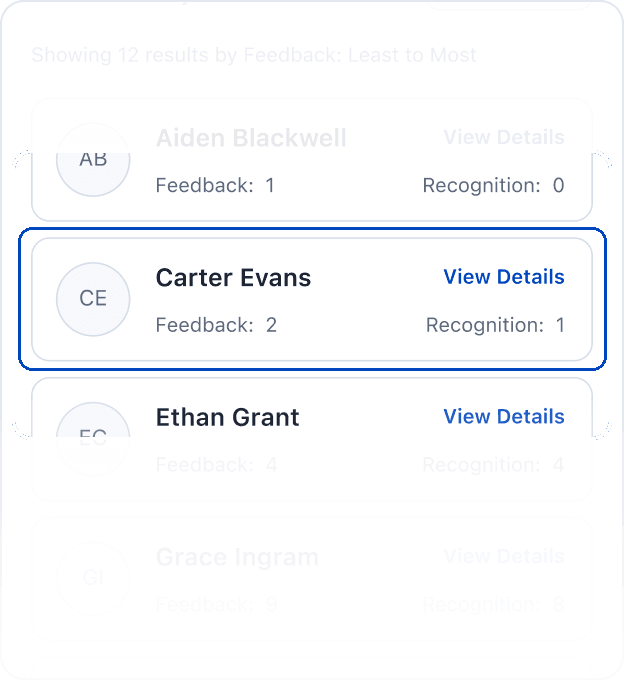
The coach count opens a list ranked from least to most active.
Coach activity
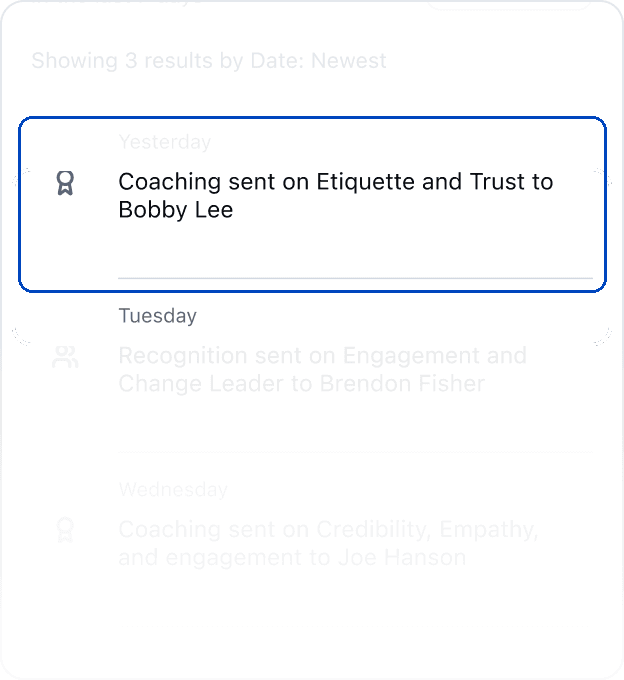
Select a coach to review activity and follow up.
Private coaching stayed private
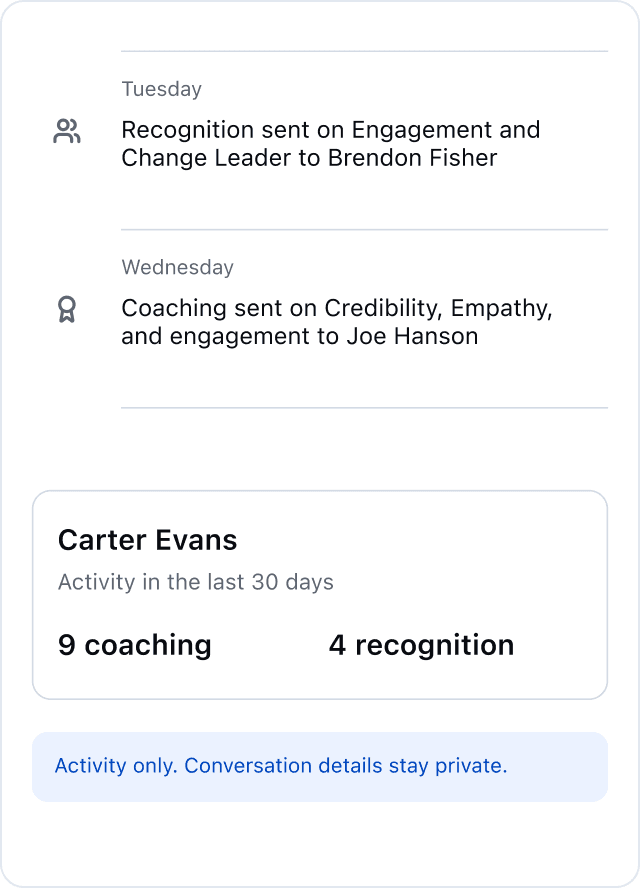
PROTECTED · EXCLUDED FROM THIS VIEW
Conversation notes
Sensitive coaching detail
Anything the employee said in confidence
Actionable
A leader can review a coach's activity and follow up without seeing the conversation notes.
Internal reporting showed more activity from Q3 to Q4
Q3 to Q4 · reported program activity
70%
more employees receiving recognition
51%
more coaching interactions
34%
more leaders providing recognition
Operating scale · later snapshot
82,469
Monthly coaching interactions reported in a separate operating snapshot.
REFLECTION
A dashboard is useful only when it changes the next decision.
Coverage gave the summary a purpose: find who needed attention. Keeping a route from each signal to a person made follow-up part of the design.